

Many retail traders struggle because they treat standard support and resistance lines like rigid concrete floors
When a stock suddenly breaks below a key level, they panic and sell, only to watch the price instantly reverse and rocket in the opposite direction.
Professional day traders view these areas differently. Instead of static lines, they look at the geometry of price. By identifying liquidity voids, structural sweeps, and order blocks on your standard charting layout, you can align your execution with major market turning points without relying on expensive software.
Explaining the Geometry: Voids and Order Blocks
To navigate market geometry, you must understand two structural footprints left by institutional orders: Liquidity Voids and Order Blocks.
A liquidity void occurs when a highly aggressive institutional buyer or seller enters the market, causing a rapid, single-direction price spike.
This aggressive movement leaves a structural gap on your chart because price moved too fast for orders to fill efficiently. The market hates inefficiency; therefore, price has a natural mathematical tendency to drift backward to fill that void.
An order block is the exact zone where that massive institutional move originally started. It is the last opposing candlestick before the aggressive breakout occurred.
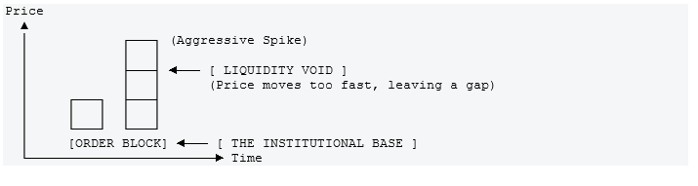
When price eventually retraces down into that original order block, it hits a concentrated pocket of residual buy orders. This makes the order block an incredibly high-probability zone to execute a long trade using a standard limit order.
The Liquidity Sweep: Navigating the Trap
The most critical geometric pattern for a day trader to master is the Liquidity Sweep. Major institutions require millions of shares to fill their positions, and they find that massive volume where retail traders place their stop-losses.
A liquidity sweep occurs when price intentionally drops just below an obvious support level. This sudden move triggers thousands of retail stop-loss sell orders. The institution eagerly steps in to buy up all of those panicked shares at a discount.
Once the retail sellers are cleared out, the selling pressure vanishes, and the stock rapidly reverses upward. This is not market manipulation; it is simply the natural clearing mechanism of a high-volume auction.
Executing with the Geometry
By recognizing this structural geometry on a clean, free charting platform, you completely remove the fear of false breakouts. Instead of buying exactly at an obvious support line where everyone else is crowded, you train yourself to wait calmly.
You let the market drop, execute the liquidity sweep, and tap directly into the institutional order block below.
Your trade entry is placed exactly where the panicked retail traders are exiting. This advanced mechanical approach ensures you secure a highly favorable risk-to-reward ratio, using the natural footprints of smart money to shield your trading capital.
related Apprentice Trader resources

Awareness is your greatest asset. By recognizing [...]

Market volatility is often viewed with anxiety by [...]

The modern trading landscape can feel intimidating [...]

Many individual investors enter the market expecting a [...]


A chaotic sea of flashing red and green [...]

To the untrained eye, rapid price movement looks [...]

A common misconception Retail traders often believe [...]

Many retail traders struggle because they treat standard [...]

Auction Market Theory Many beginners judge the [...]

 AAPL
AAPL 
 AMZN
AMZN 
 MSFT
MSFT  TSLA
TSLA  GC=F
GC=F  SI=F
SI=F  NG=F
NG=F  ADBE
ADBE  META
META  NVDA
NVDA  AVGO
AVGO  LLY
LLY  WMT
WMT  AMD
AMD  JNJ
JNJ  CSCO
CSCO  ORCL
ORCL  C
C  KO
KO  DOW
DOW  BTC-USD
  ^IXIC
^IXIC